Reports
With Nautilus' real-time reports, you can actively monitor the health and performance of your wallet. Additionally, these reports offer insights into the performance of your business, highlighting trends that can inform strategic decisions.
Overview
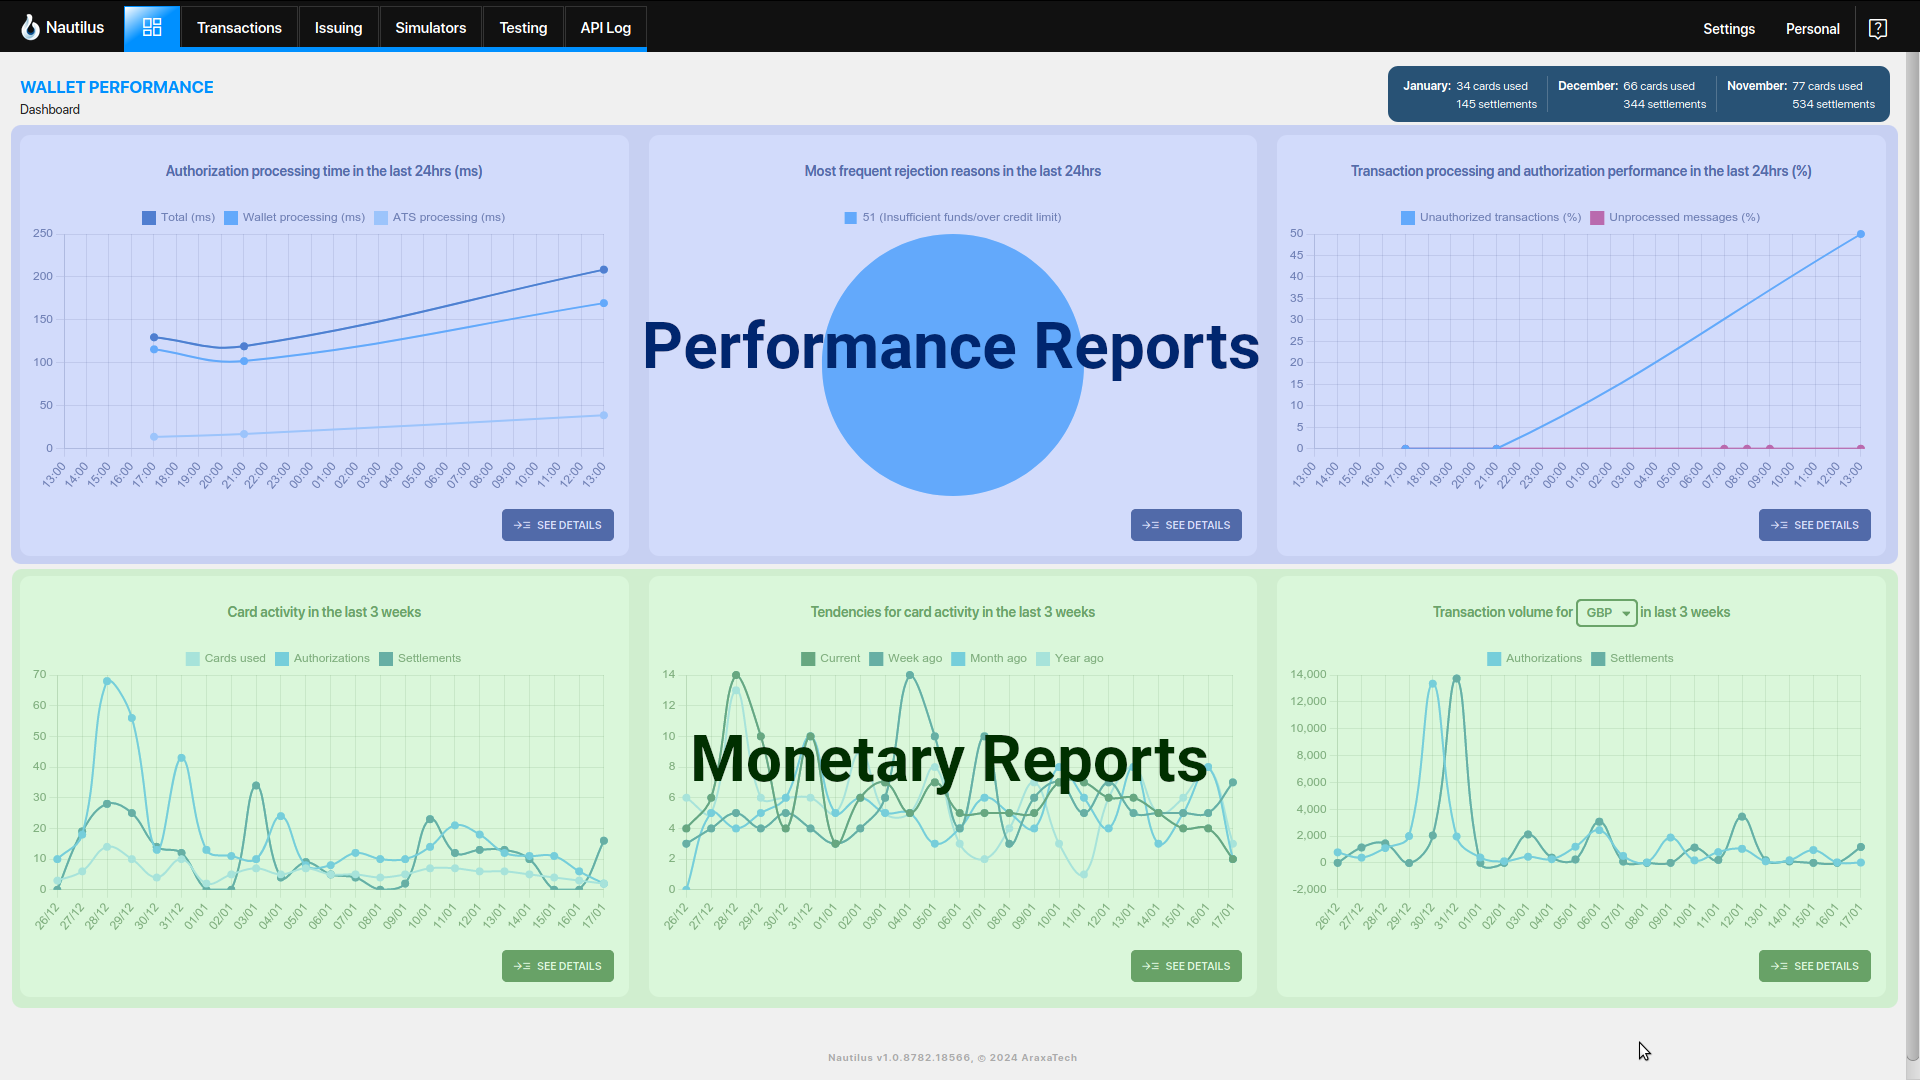
Nautilus dashboard shows reports about the most important aspects of wallet behavior and about business performance. These reports fall into two categories:
- wallet performance reports
- monetary reports
Wallet performance reports help assess the wallet’s health. They offer insights into the recent behavior of the wallet, covering aspects like speed, message processing performance, and reasons for transaction rejections. These reports serve as indicators of whether the wallet is aligning with expected behavior. Each report includes a list of characteristic transactions, enabling a detailed inspection of communication details with the wallet to understand transaction handling. Reports in this category include:
- Authorization processing time
- Most frequent rejection reasons
- Transaction processing and authorization performance
Monetary reports help assess the wallet’s business performance. They provide data about the number and the value of processed transactions and the number of active cards. Trend reports facilitate a comparison of the wallet's current performance against historical data. In the development phase, monetary reports serve as a reference for creating reports within the wallet system. Reports in this category include:
- Card activity
- Tendencies
- Volume report
You can click on the “See details” button for each report on the dashboard to see more details on the report, including some data that is not visible on the dashboard.
Authorization Processing Time
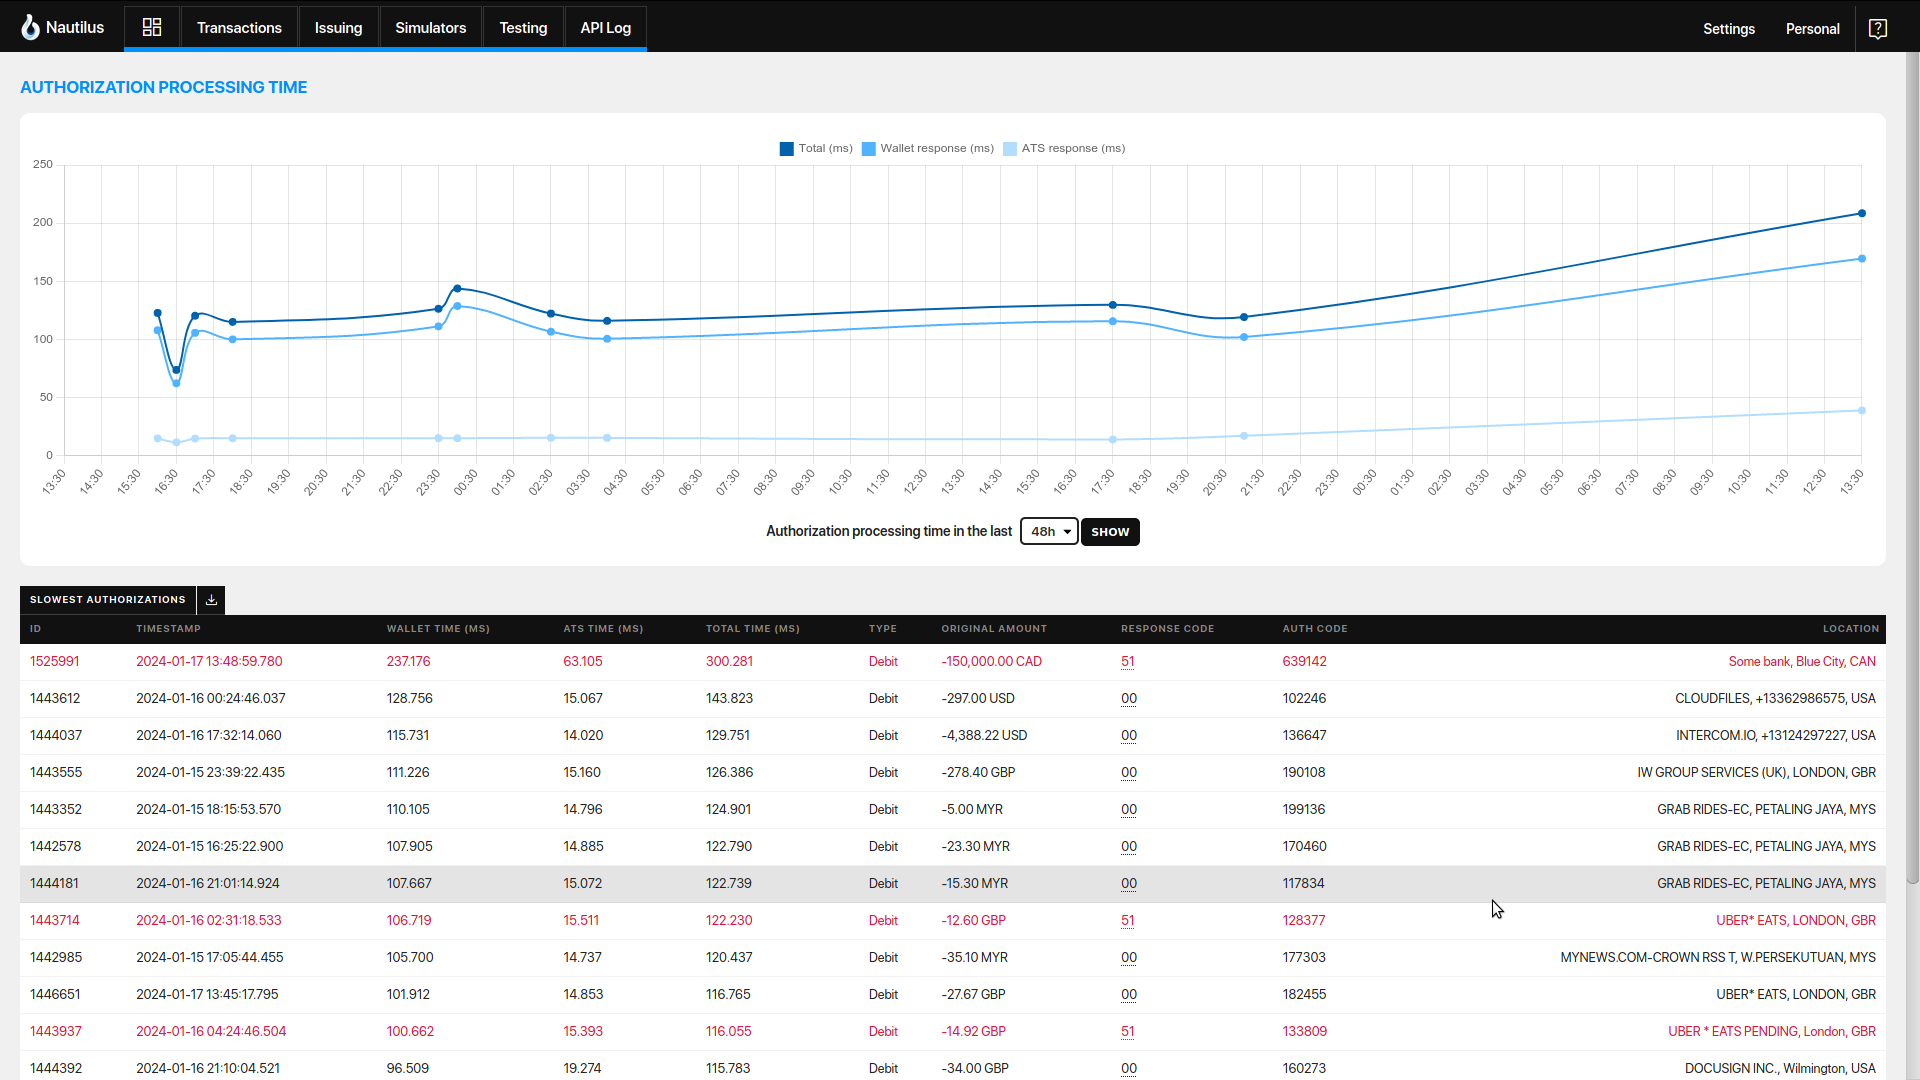
This report shows the time spent to process authorizations, giving visual breakage between time spent within wallet and Nautilus system itself. You can set intervals you are interested in, and you can also get a list of transactions with the worst performance. Using this list, you can investigate in detail what exactly happened on the wallet side to help you pinpoint spots that might need optimizations within wallet.
Most Frequent Rejection Reasons
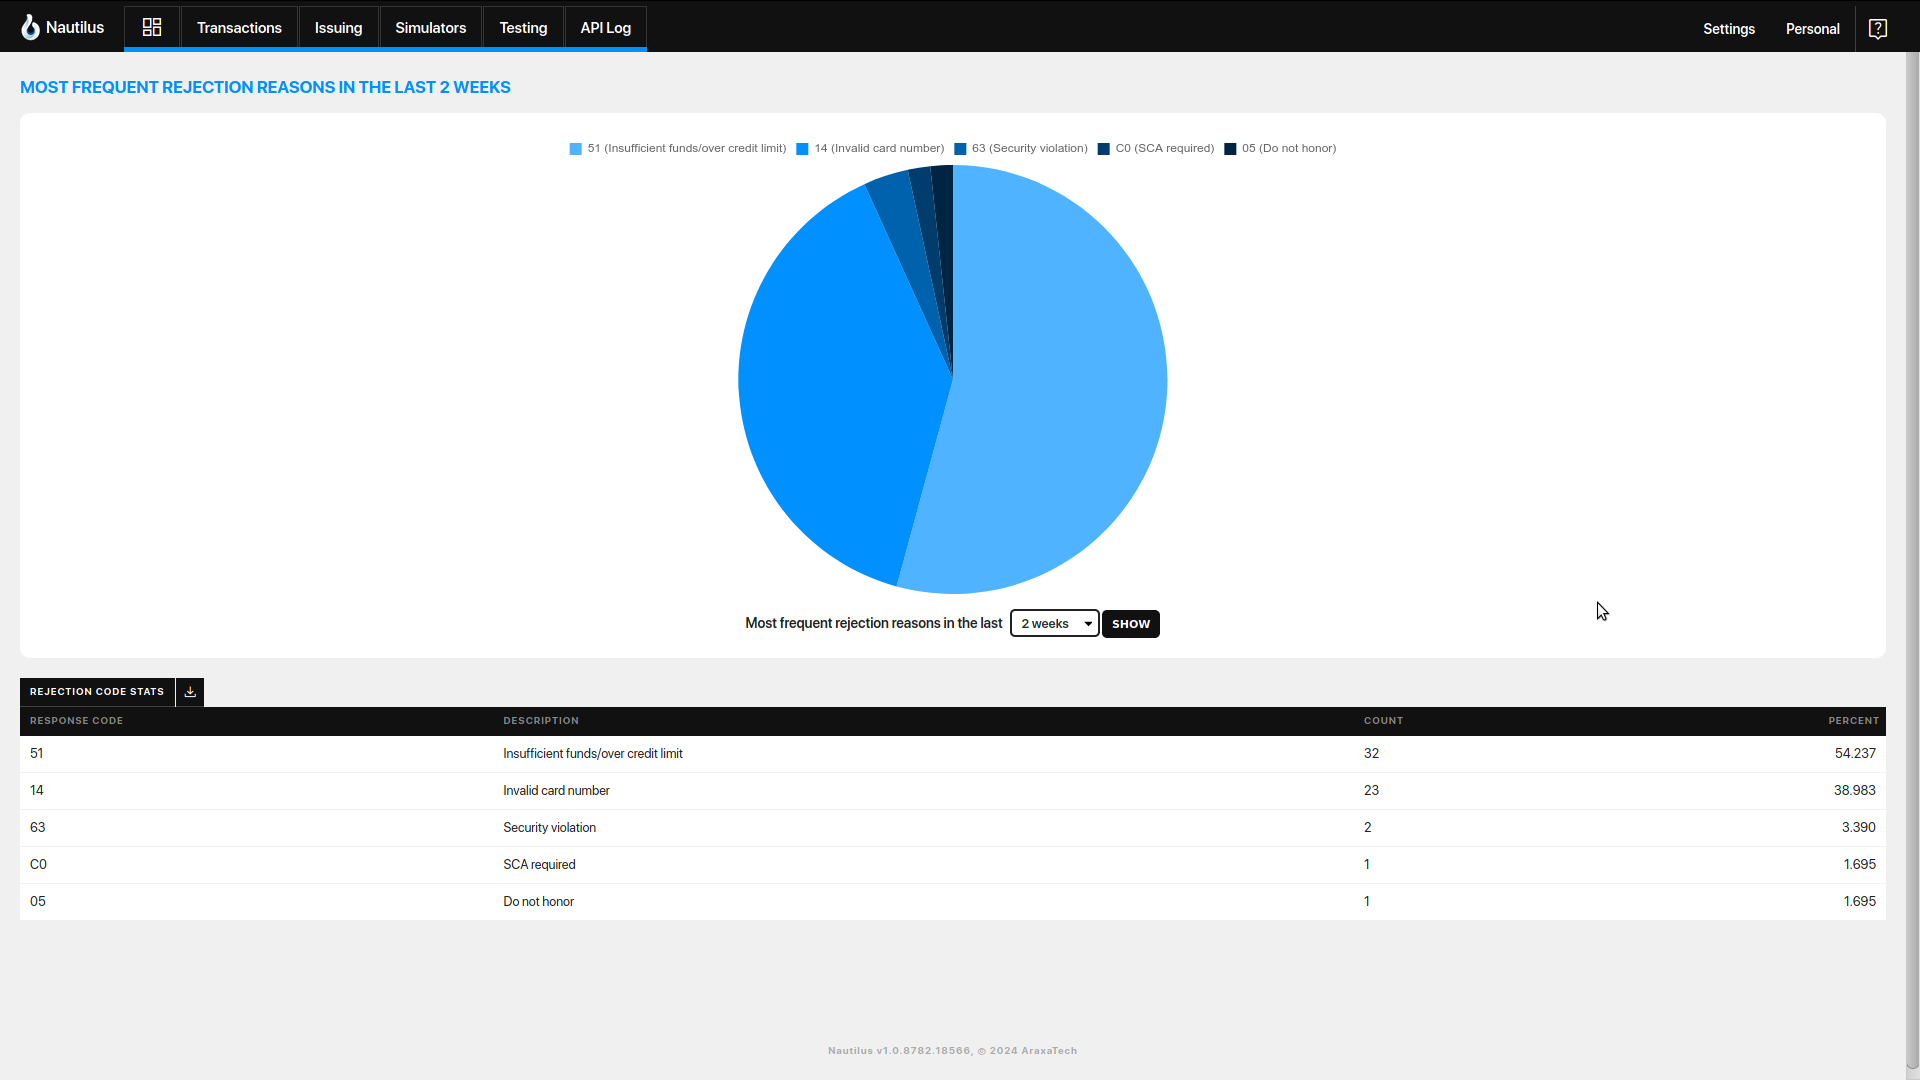
This report shows a list of the most frequent reasons for rejected authorizations. This report gives you insights into why authorizations for your cardholders are failing (sometimes this can lead to unexpected revelations). The report also gives you a table with a detailed breakdown of information and with a list of transactions for each specific rejection reason, which you can use to investigate things further on the wallet side.
Transaction Processing and Authorization Performance
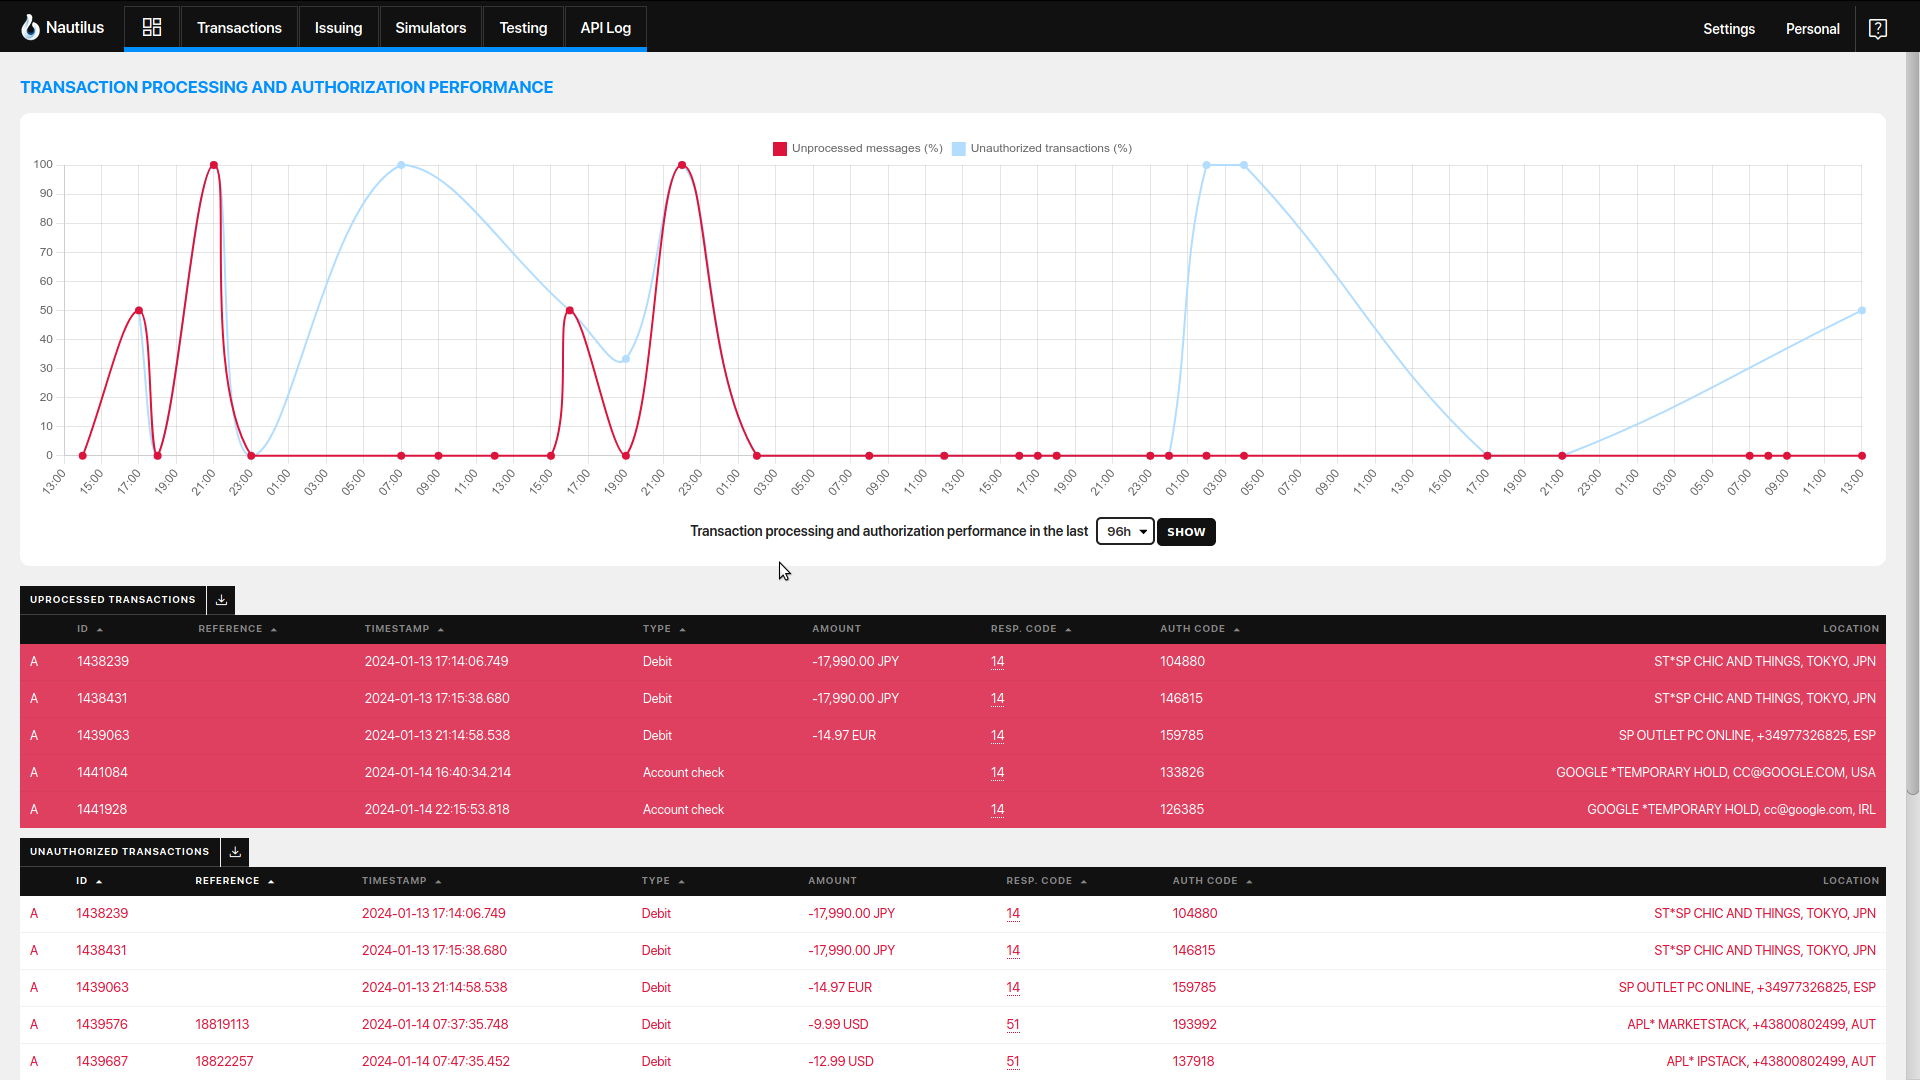
This report shows you two very important metrics for every wallet’s performance:
- Percentage of rejected authorizations
- Percentage of unprocessed transactions
General guidelines suggest aiming for 0% unprocessed transactions and minimizing the number of rejected authorizations. The threshold for "not too many" rejected authorizations may vary depending on the specific case, but typically, maintaining a figure below 5% is considered reasonable.
Each table is accompanied by a dedicated transaction list, showing a detailed list of transactions categorized as rejected authorizations or those that failed to process entirely on the wallet side. This allows for a closer examination and understanding of the specific issues affecting these transactions.
Card Activity
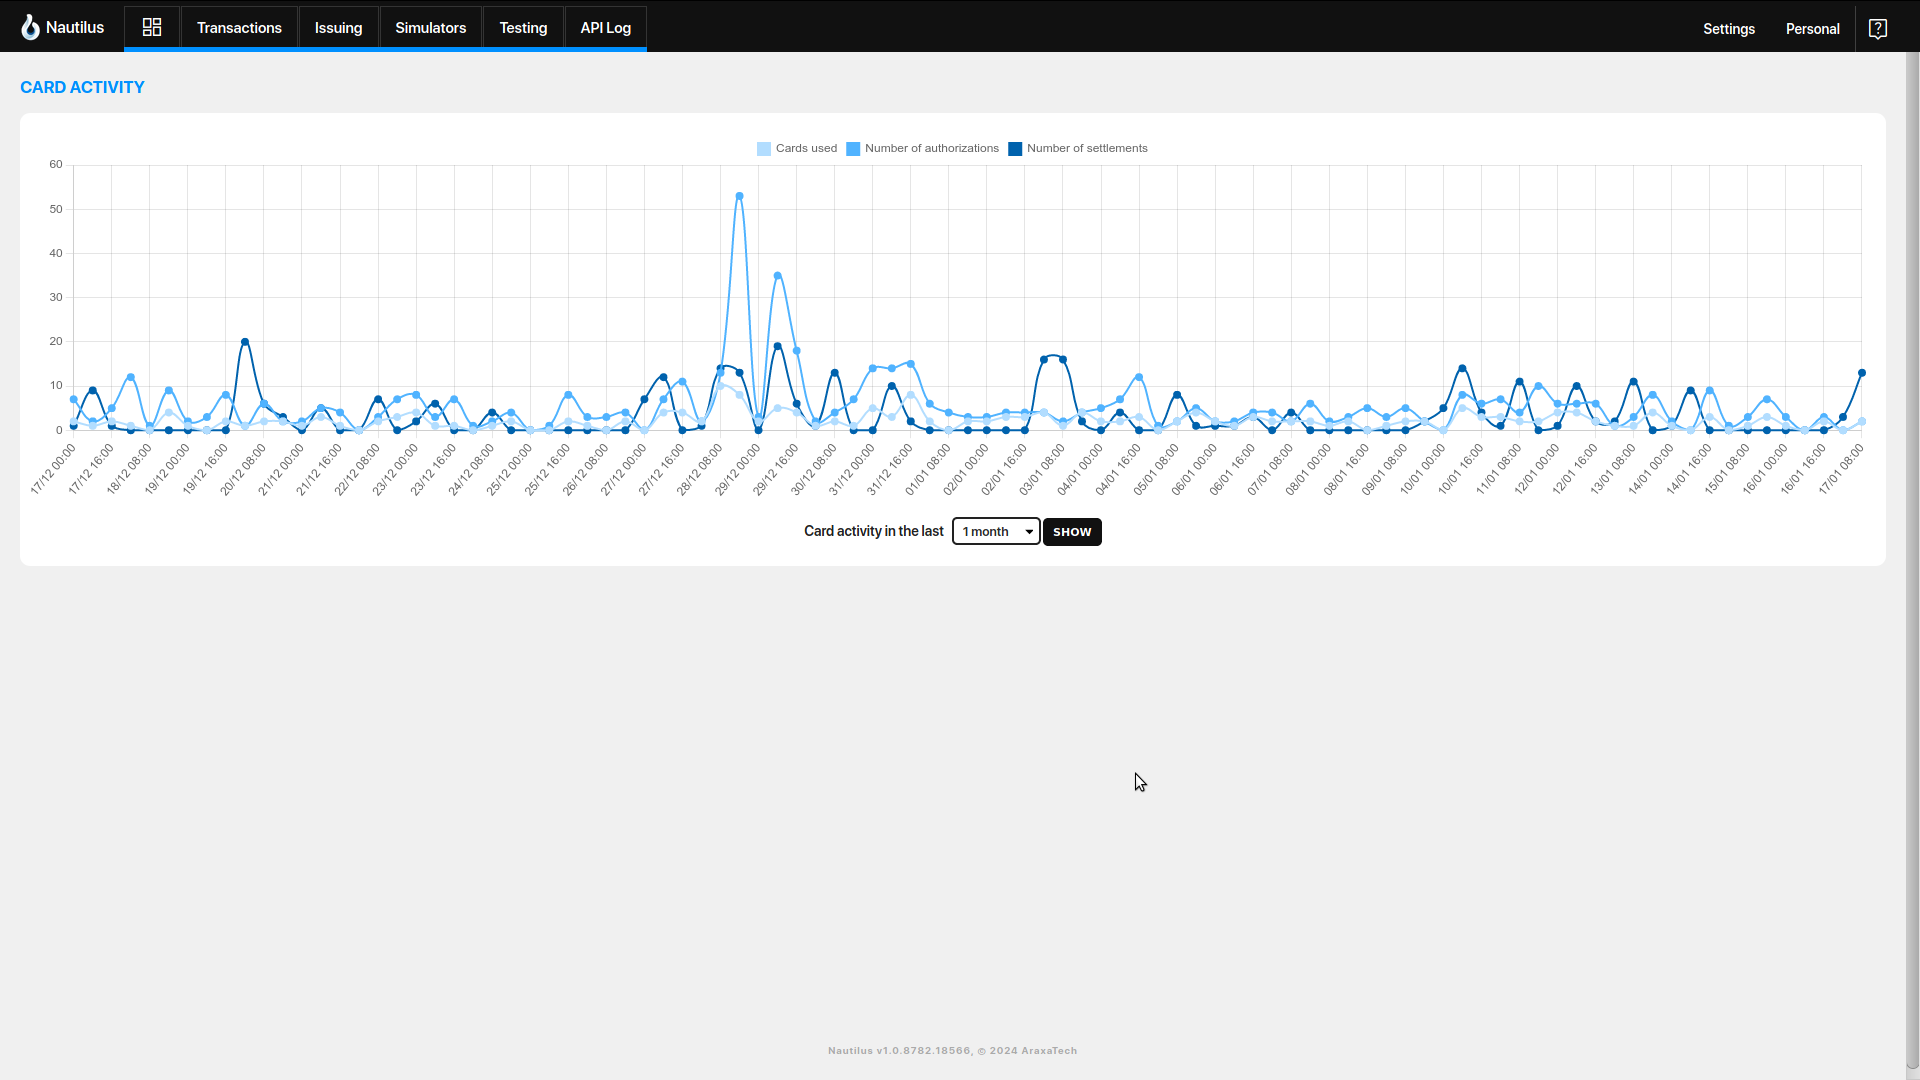
This report provides insights into the daily card usage, including the number of active cards (considered active on a day with at least one real-world interaction, i.e., an authorization request), the number of authorizations, and the number of settlements received. Ideally, the number of settlements should closely align with the number of approved authorizations from the previous day. Additionally, the variance between the number of active cards and authorizations can offer insights into the average card usage per cardholder, with the expectation that the number of active cards should not exceed the number of authorizations. Monitoring these metrics helps gauge card activity and transaction patterns.
Tendencies
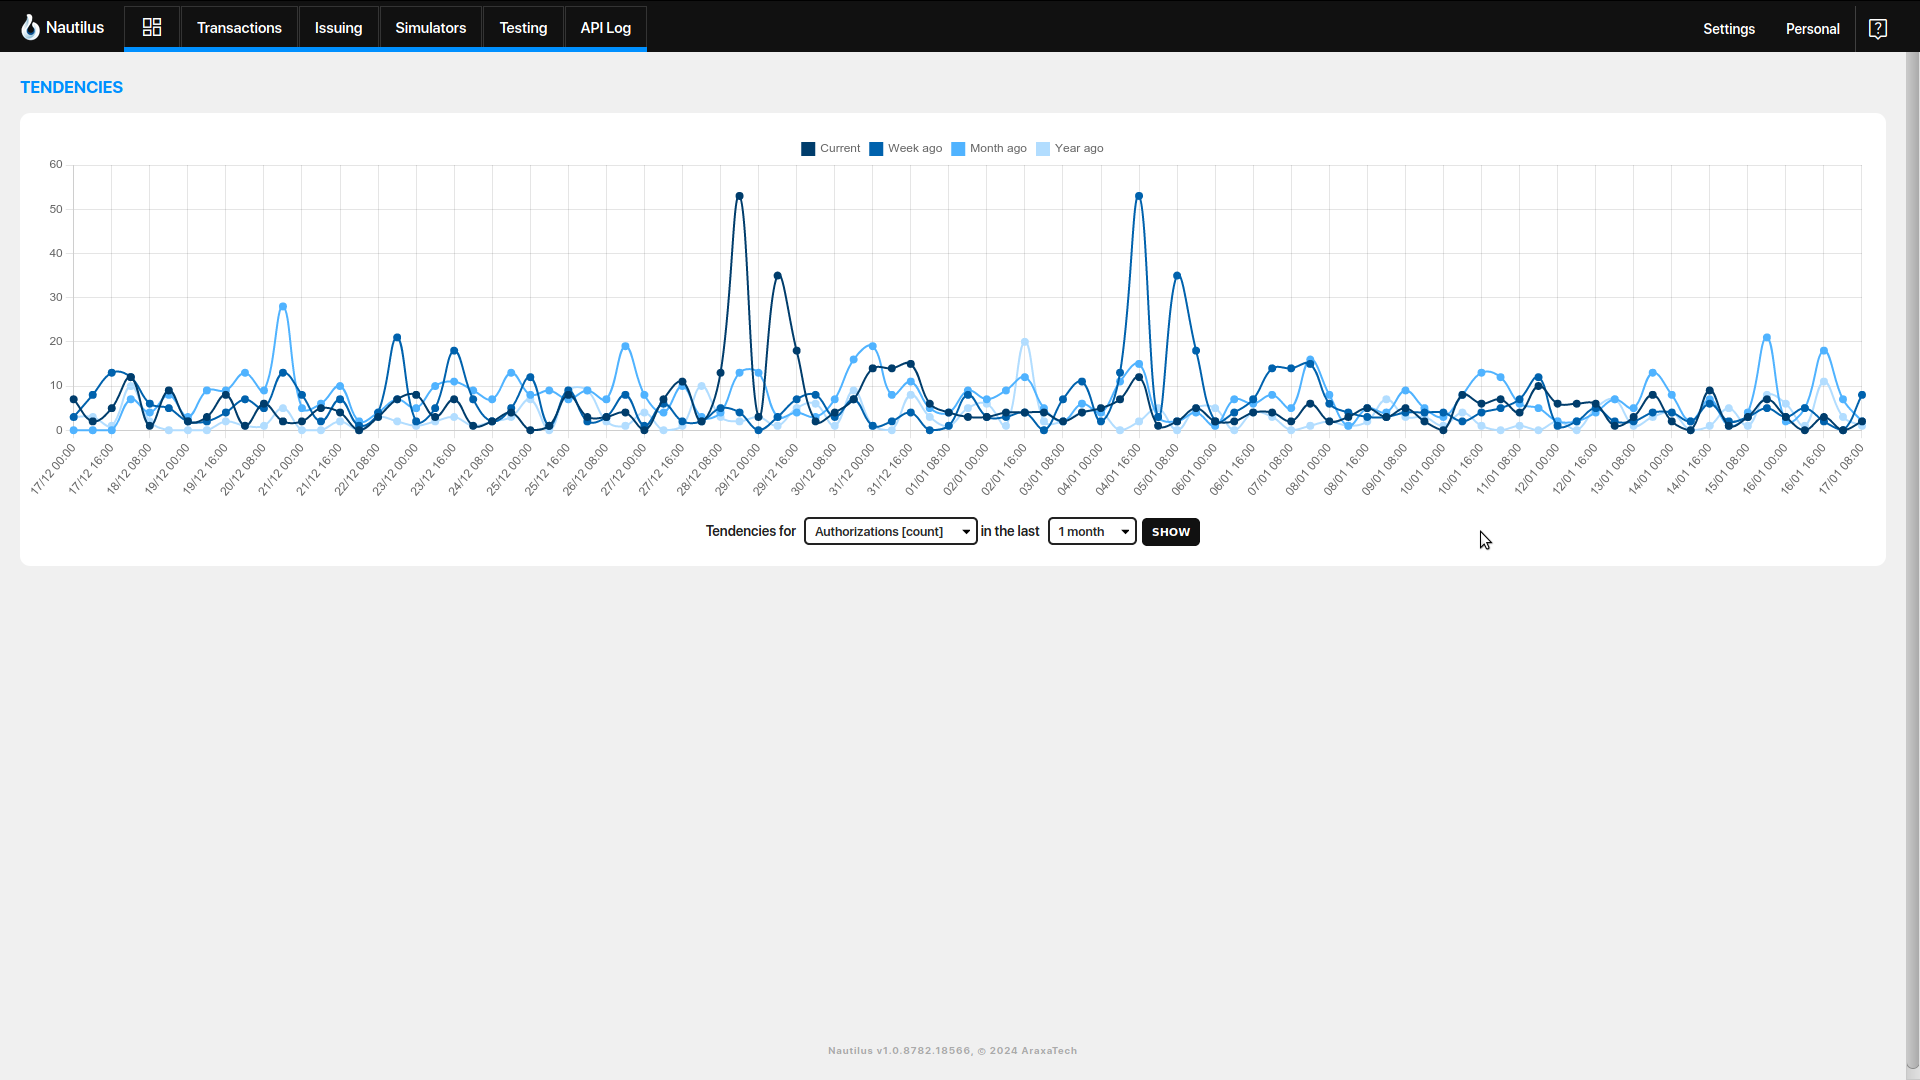
This report provides a visual representation of business performance trends by overlaying four distinct graphs on the same diagram. The graphs illustrate the performance for the current day, one week ago, one month ago, and one year ago. This approach allows you to intuitively assess whether your business is experiencing growth over time. Comparing these different points in the past to the current performance helps provide a meaningful picture, accounting for inherent periodicities (e.g., higher card usage on Mondays). This comparative analysis aids in understanding business trends independent of specific temporal patterns. (for example, the card usage is always higher on Mondays, so it doesn’t always make sense to compare it to the value one month ago, but it does make sense to compare it to the value one week ago).
Tendencies diagram can show you data about few different metrics:
- Card activity
- Overall authorization count
- Overall settlement count
- Settlement count for specific currency
- Settlement volume for specific currency
- Cardholder fees for specific currency
- Interchange fees for specific currency
Volume Report
This report shows the monetary value of transactions in the chosen period. It shows the values corresponding to authorizations and to settlements (usually the value for settlements is close to the value for authorizations 1 business day ahead). This report can show you several different metrics:
- Value of the transaction for a specific currency (approved authorizations and settlements),
- Value of cardholder fees for a specific currency (those corresponding to authorizations and settlements),
- Value of interchange fees for a specific currency (most often, the authorization data doesn't contain it, so it is zero).

